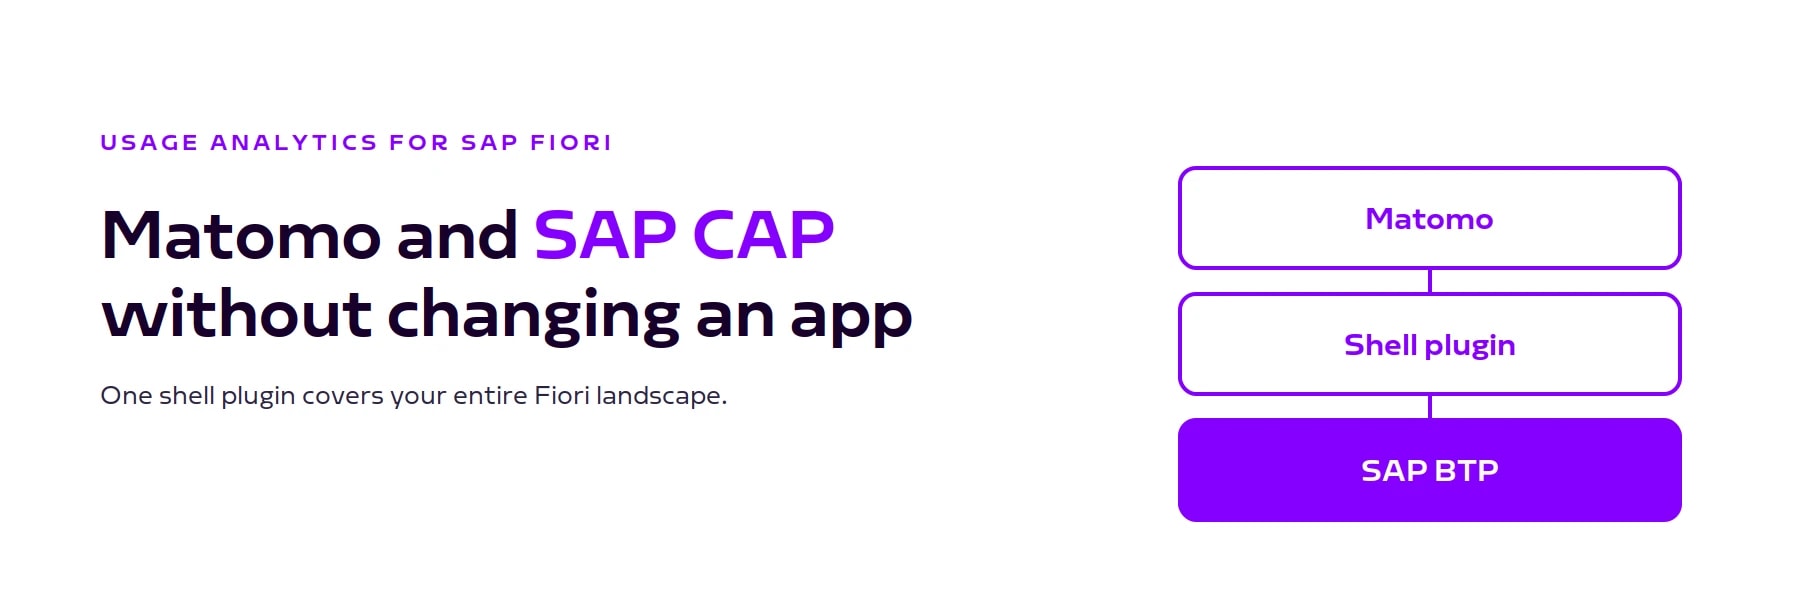
SAP Web Analytics was retired in 2022 and no successor followed. How to add Matomo through an FLP shell plugin while leaving your existing applications untouched.

Your Fiori apps are live. But do you know which functions people actually use? Where they abandon a task? Which area has not been opened once since go-live?
In most projects the answer is no. Development budget then goes to the feature someone asked for loudest, not the one people need most.
SAP does not close this gap. SAP Web Analytics, its own service for this, was retired on 31 August 2022 (opens in a new tab). No successor followed. The good news: Matomo can be added with reasonable effort, and in a way that leaves your existing applications untouched.
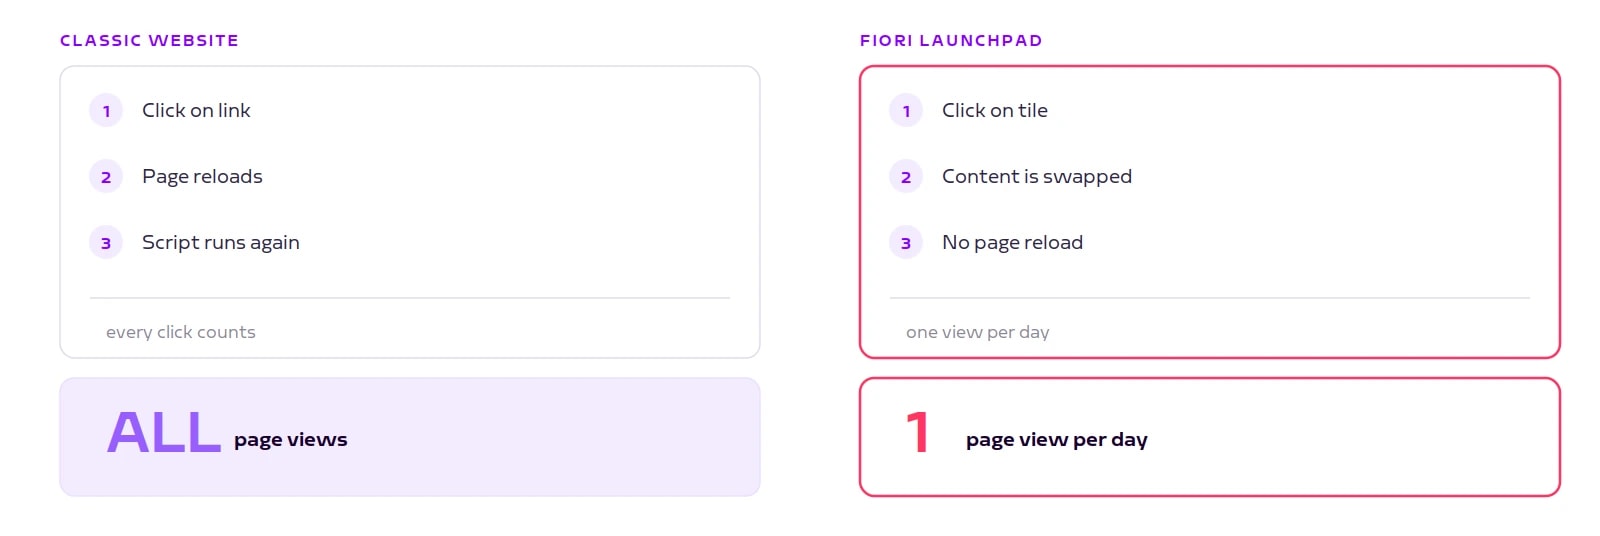
On a classic website the browser counts for you. Every click loads a new document, the analytics script runs again and reports a page view. That is why web tracking there takes five minutes.
The SAP Fiori launchpad works differently. It is a single-page application, meaning one page that loads once and then swaps its content via JavaScript. The browser loads exactly one document, in the morning at sign-in. After that, apps are moved in and out of the content area without a page reload.
A standard snippet therefore delivers one page view per user per working day. Everything after that stays invisible.
The obvious fix would be to add tracking code to every app. With two applications that works. With twenty you have twenty copies drifting apart, and every new app has to remember.
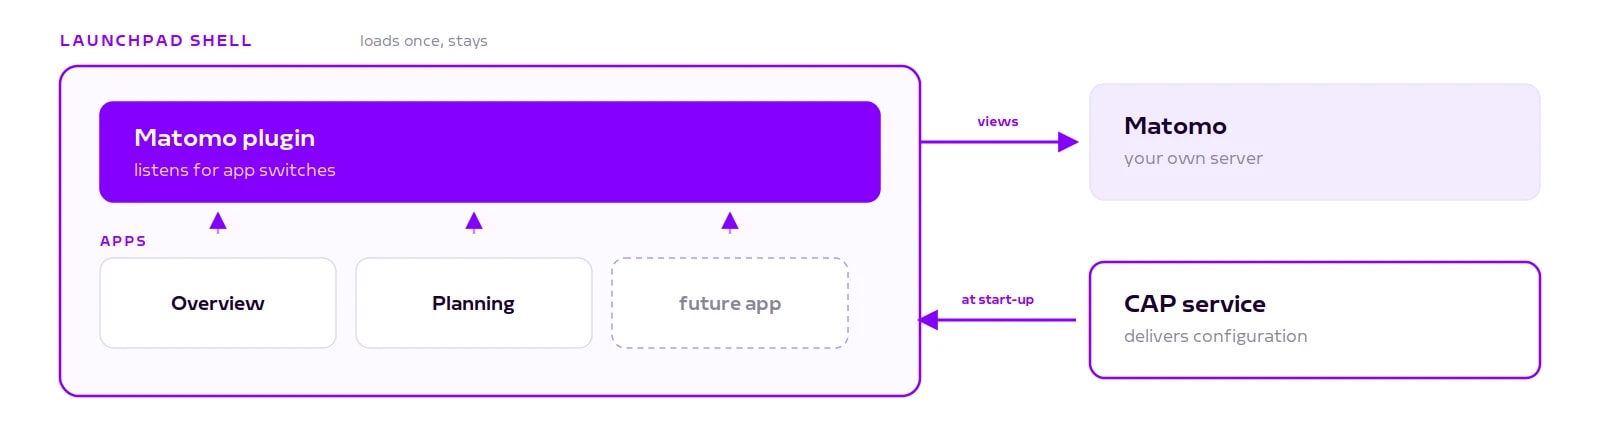
The durable approach uses an official SAP extension point: an FLP shell plugin. The shell, the launchpad frame with its header and tiles, exists exactly once and stays for the whole session. A plugin is loaded at start-up and reports every switch between applications.
The mechanism behind it is a message channel in SAPUI5. The shell publishes a message on every app switch, the plugin listens. Neither knows the other. That is why applications that do not exist yet are covered automatically.
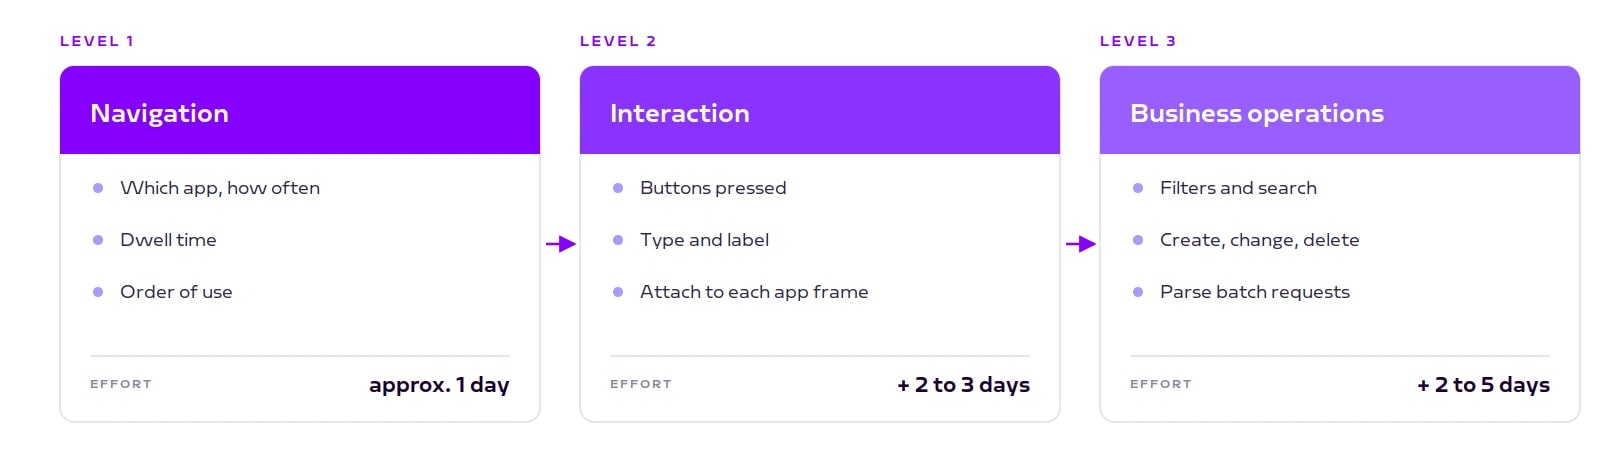
Level 1: navigation and dwell time. Which applications are opened how often, used how long, in what order. Effort: about one day. This already answers the most common question from the business side.
Level 2: interaction. Which buttons are pressed, with type and label. This gets harder, because SAP Build Work Zone renders apps in an embedded frame. A listener in the shell does not see clicks inside the app. Each app frame has to be attached individually.
Level 3: business operations. Which fields are filtered on, what gets created, changed, deleted. Technically the most demanding level: OData bundles read requests into one batch call, and filter criteria sit in the message body, not in the address.
Two things, and both are smaller than they sound.
The configuration endpoint. The analytics server address, the site ID and the numbers of the custom dimensions do not belong hard-coded in the plugin. Otherwise you need a separate artifact per environment. A small endpoint in your CAP service delivers these values at runtime, fed from environment variables. One detail matters: register it on the Express server during the bootstrap phase, not as a CAP service. CAP secures all endpoints by default (opens in a new tab), and the plugin loads its configuration before any sign-in has happened.
The server-side addition. Matomo has an interface you can call directly from your application logic. A handler in CAP reports business events without anything happening in the browser. This is immune to ad blockers and needs neither a plugin nor a Work Zone approval. You see which operations run, but no navigation and no dwell time. In practice the combination is the most robust setup.
The SAP built-in tools are not useless, they answer a different question. @cap-js/telemetry and SAP Cloud Logging deliver operational data: response times, error rates, load. If you want to know whether a service runs reliably, they are the right tool. The usage statistics in SAP Build Work Zone measure the site, meaning tiles and areas. The moment someone clicks a tile, their view ends.
Matomo has limits too. It only sees what happens in the browser. Background processing, interfaces and batch runs stay outside. For those you need the server-side variant or your existing logging.
For applications used by your own employees, introducing usage analytics in Germany requires works council agreement under section 87 (1) no. 6 of the Works Constitution Act. What counts is not your intention but the system's suitability for monitoring behaviour. Without a works agreement, the works council can have operation stopped. Comparable rules apply in other European countries.
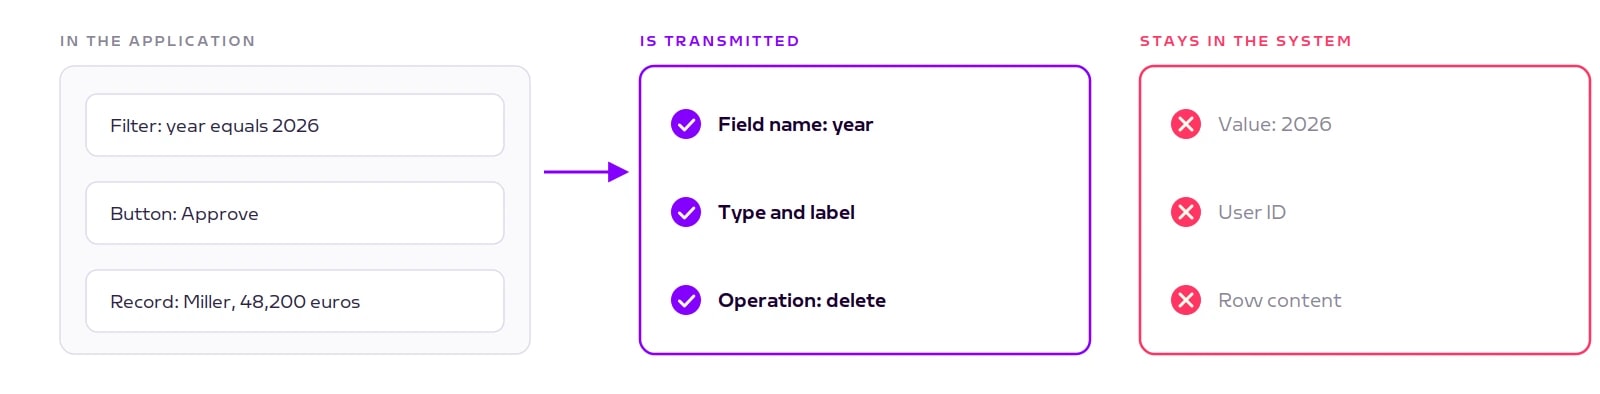
The setup can be built to withstand that review: no user ID, operation without cookies, truncated IP addresses, visitor log switched off, raw data deleted after 90 days. Only structural information is transmitted, meaning field names and labels of controls. Never field values, never row content. For a filter on "year equals 2026" the field goes out, not the value.
These points should reach the works council as concrete technical commitments. An open statement of intent tends to add months to the process.
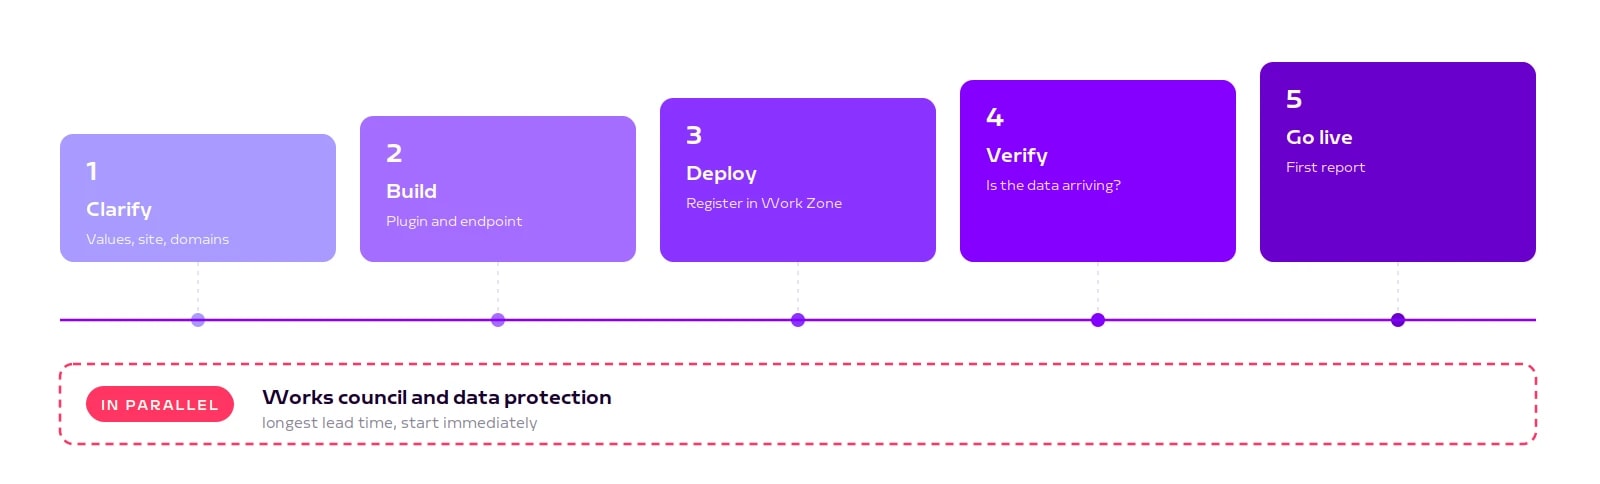
Technical implementation for level 1 takes about a week. Your existing applications stay untouched, future ones are covered automatically. The pacing factor is the agreement with your works council and data protection officer. Start that track alongside development, not after it.
The most useful question up front: which decision do you want to make with this data? Naming it beforehand produces a far more usable report. Often it turns out that level 1 is entirely enough.
Book a call
We have run this path end to end, from the shell plugin through Work Zone registration to the works council proposal.
Send us a note or book a short meeting.
